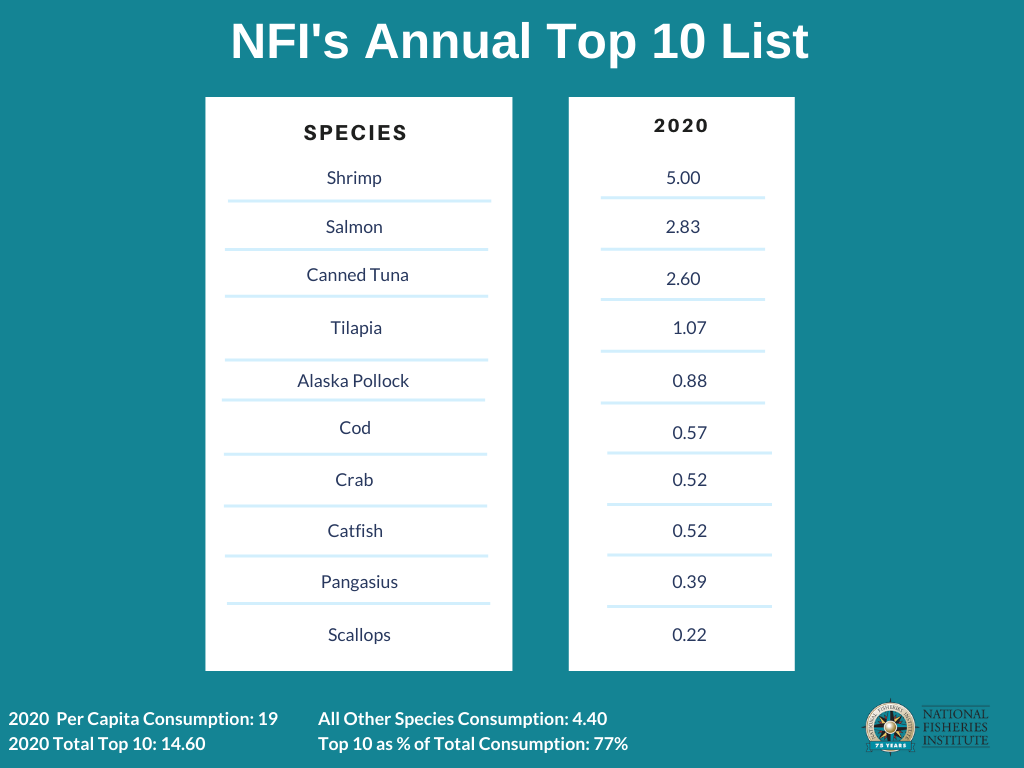
In 2020, Americans ate 19 pounds of seafood per capita, down slightly from 19.3 pounds in 2019, according to the latest Fisheries of the United States statistics crunched by National Oceanic and Atmospheric Administration (NOAA) and compiled into a Top Ten list by the National Fisheries Institute (NFI).
The onset of the Covid-19 health crisis brought significant disruption to traditional business operations and consumer behaviors. While restaurants were forced to shutter, there was an impressive uptick in seafood purchases through retail channels, but apparently not enough to find an equilibrium in the first full year of the coronavirus pandemic.

With a reputation for versatility at home and in foodservice, Shrimp (primarily distributed to end-users in frozen form) not only maintained the top spot but grew its number, reaching a record for the shellfish at 5 pounds per person. Salmon was second at 2.83 pounds per capita. Shelf stable stalwart Canned Tuna, at No. 3, saw a jump in consumption, as did a variety of White Fish species.
Tilapia ranked No. 4 at 1.07 pounds, followed by Alaska Pollock (0.88), Cod (0.57), Crab and Catfish (0.52, respectively); Pangasius (0.39); and Scallops at No. 10 (0.22 pounds).
Overall, the Top Ten species accounted for 77% of total seafood consumption in the US.
The raw data provided by the Washington, DC-headquartered National Oceanic and Atmospheric Administration is historically retrospective, so pandemic-related market forces will likely only be fully illustrated by data released over the next few years.
“The next Top Ten list could answer some long-held questions,” said Richard Barry, programs director of the National Fisheries Institute. “Keep in mind, experts at the Global Seafood Market Conference, in January, were busy mapping a predicted overall increase in pandemic-era seafood consumption and species diversification trends, so watch this space.”
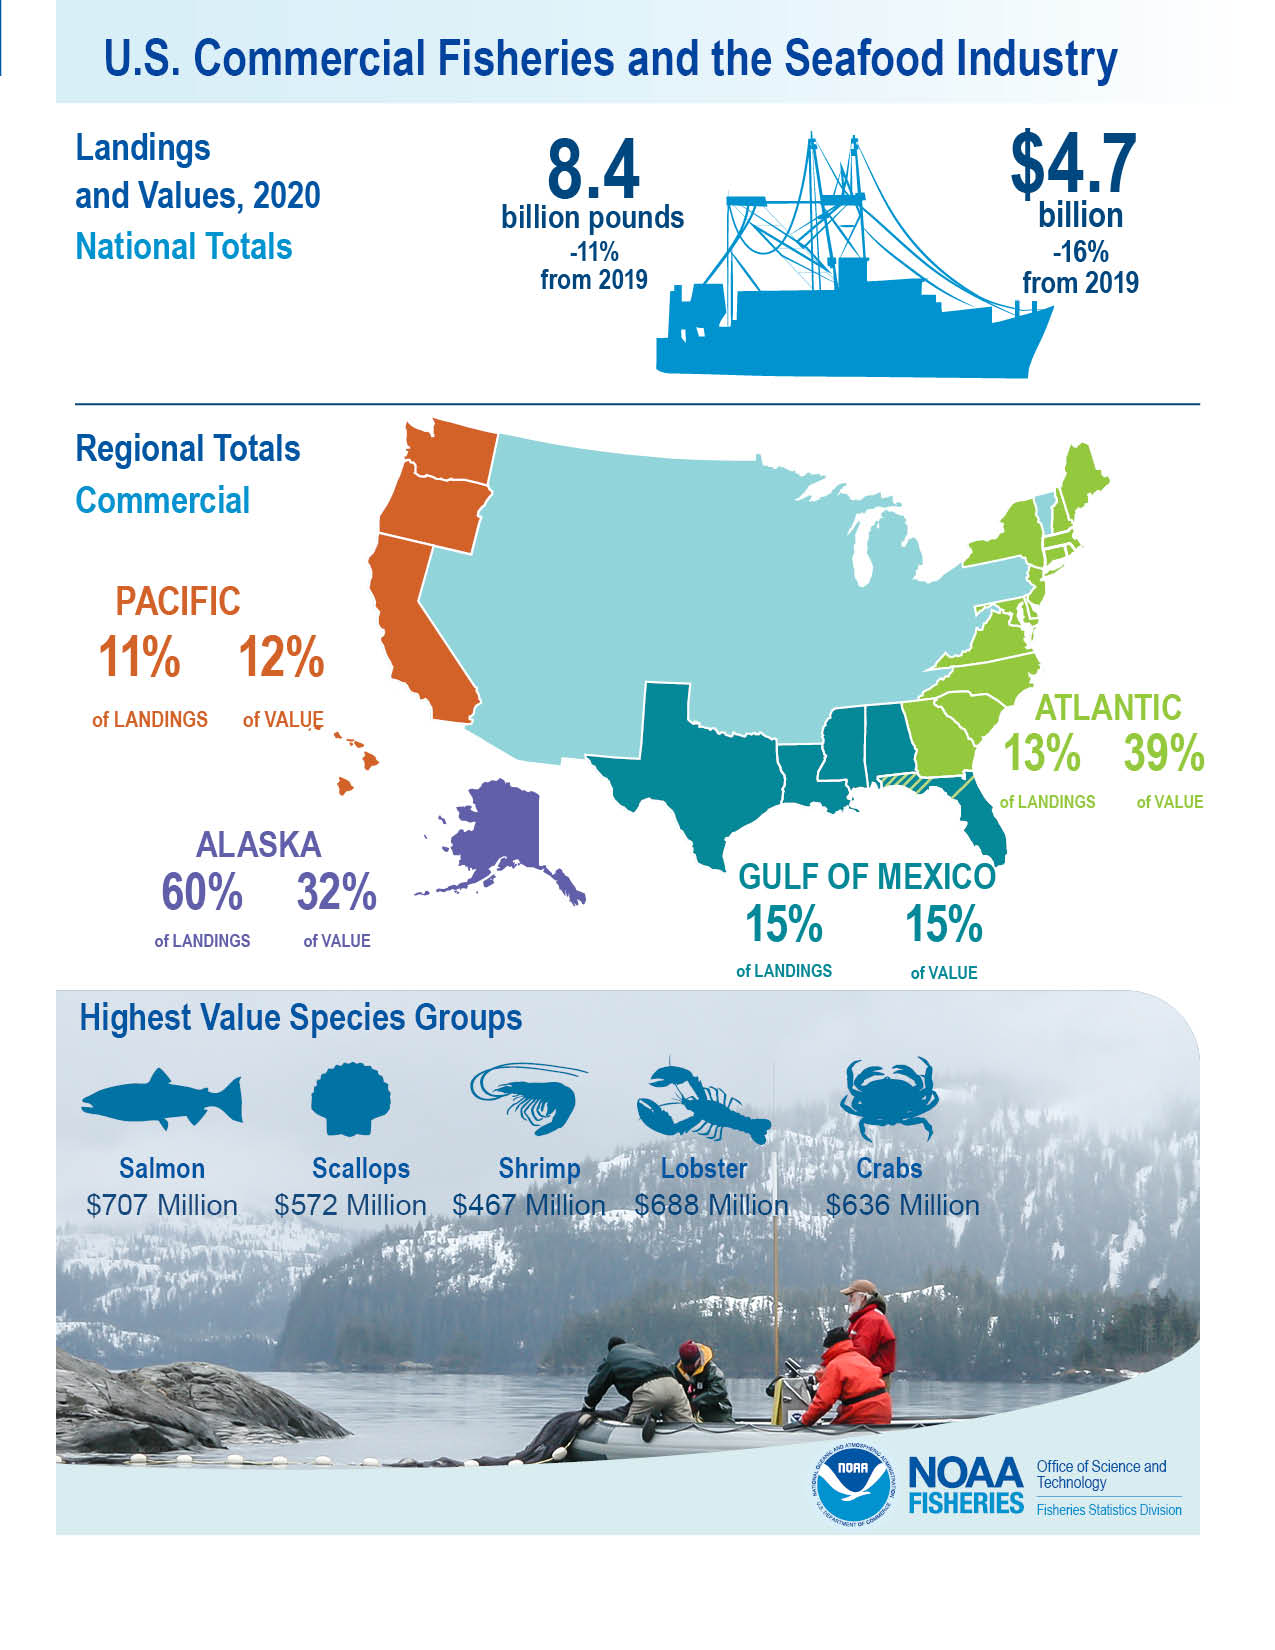
NOAA also published detailed statistics about US commercial fishery landings in volume and value terms, in addition to regional breakouts, highest landing value species groups and top ports by value, some of which are detailed in the infographic below.


